Result
Overview of CFA Result
CFA exam results show you more than just numbers. Recently, the CFA Institute changed the way they used to report your results. Now, in the new setting, they show you plenty of information to analyze your overall performance.
To help you get the most out of your results, we have created a comprehensive guide on how to interpret your CFA results. Which will help you going forward with your next exam.

GANESH NAYAK
First Look of CFA Exam Result.
For the first time in the last decade, in December 2017, the CFA Institute changed its way of reporting your results. Now, the candidate receives their results in a pass/fail format directly into their registered email after 60 to 90 days of the exam.
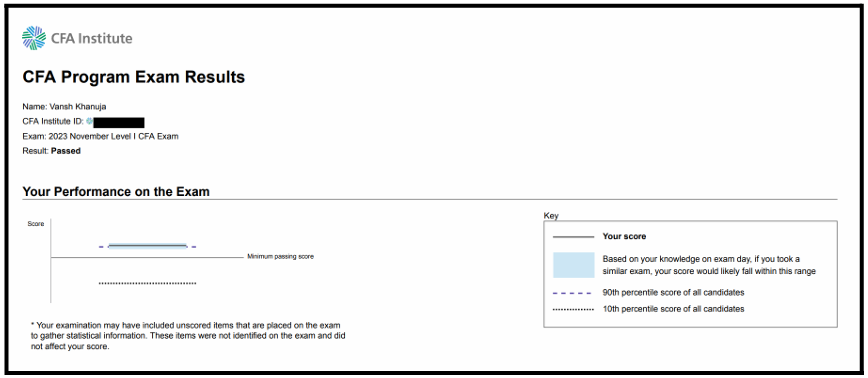
Even though the CFA Institute doesn’t reveal your actual score, they allow you to interpret your performance, whether it is good or bad, with the help of a PDF of your results that you can get from the CFA Institute website. With this chart, you can analyze your performance compared to others, which will help you in your next level or your second attempt.
CFA Result Summary
Interpretation Of CFA Result
Let’s understand each element thoroughly.
Your Score

● If you fall above the thin line, congratulations; you have passed the exam.
● If you fall below the thin line, unfortunately, you failed the exam.
True Ability
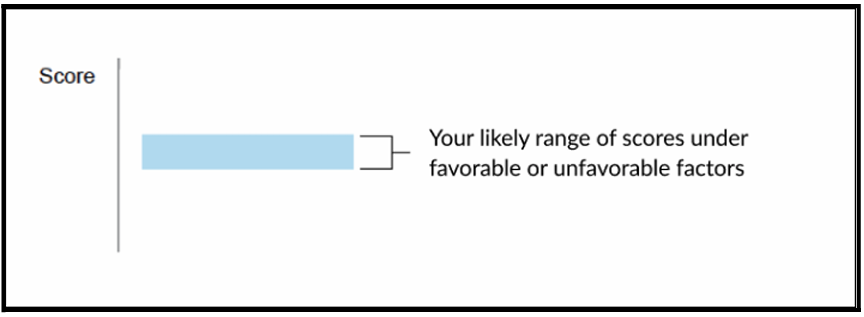
Positive Factors
● You got enough rest and food before the test.
● You made some extremely fortunate assumptions.
● The setting for testing was comfortable.
Negative Factors
● You had trouble sleeping or felt quite anxious.
● You either made a small mistake on a question you would often get right or your guesses were unlucky.
● The testing setting was uncomfortable or distracting.
 ) represents the range by which your score may have been affected by these other factors.
 Confidence Interval
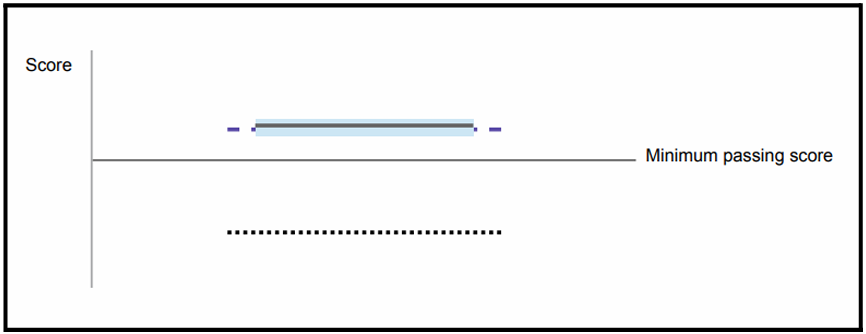 ). Your true ability on exam day likely falls somewhere in this range, as do your marks on tests that are similar but have different questions, given the nature of the exam.
 Performance Relative to Others
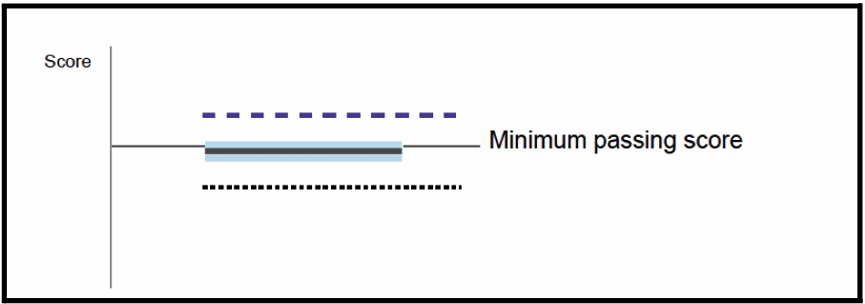
● The 90th percentile score is shown by the thick purple dashed line ( _ _ _ _ ). 10%ofapplicants received exam scores greater than this.
● The 10th percentile score is indicated by the thick, black dotted line ( ……. ). 10%of applicants received exam scores below this.
Confidence interval
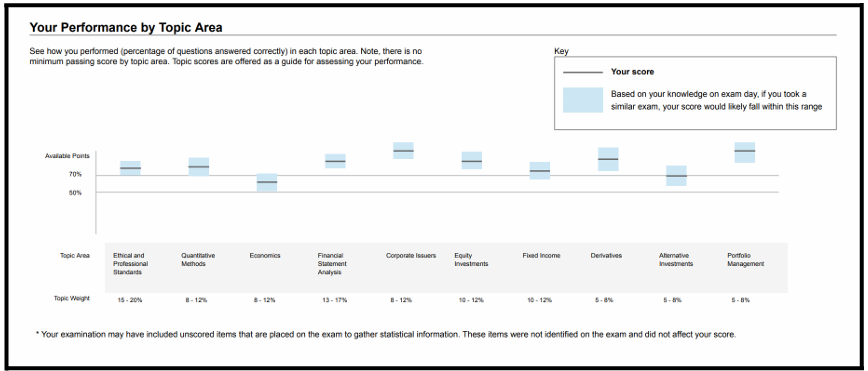
) When looking at these scores, think about your own experience too. If you did much better than expected, your true ability might be lower than what the score suggests. On the other hand, if you did worse than expected, your true ability might be higher. But generally, if you scored well above 70%, you can be more confident about mastering that topic. Candidate Percentile Score
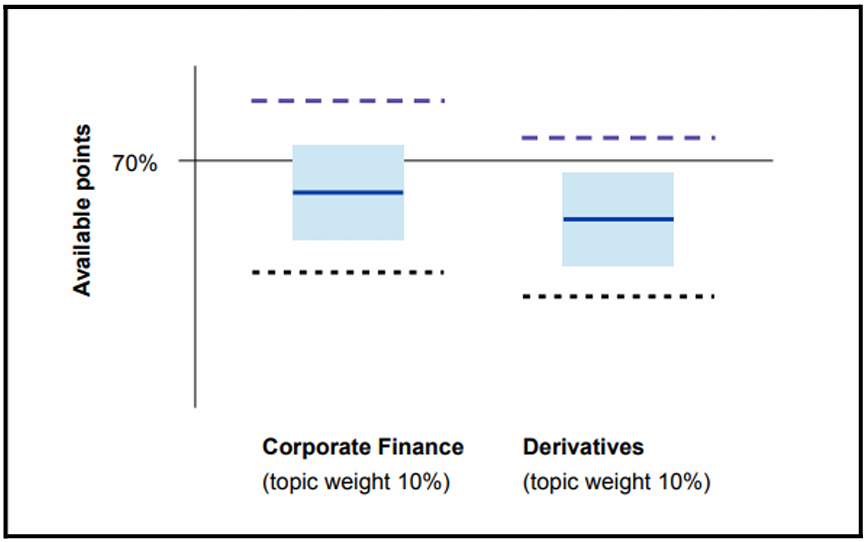
• The difficulty of the topic was indicated by the 90th-percentile candidate line ( _ _ _ _ _ ).
• The easier the topic, the higher the 10th-percentile line ( _ _ _ _ _ ).
You can obtain a more comprehensive understanding of your performance by aggregating the results of other candidates, your own score, and the confidence interval. A higher indicator of mastery than 70% on an easier topic with a larger confidence interval is 70% on a hard issue with a narrower confidence interval.